Get a Free 1 oz Silver Round with Your First Order Over $199!
Get a Free 1 oz Silver Round with Your First Order Over $199!
Login
|
Register

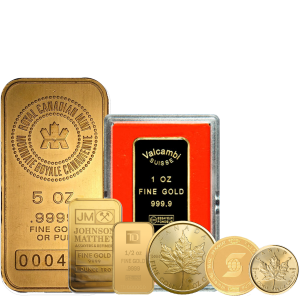
- Gold
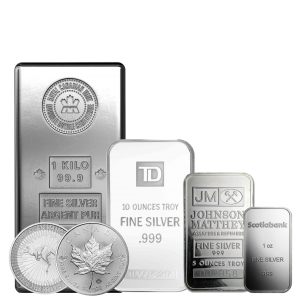
- Silver
- Platinum
- Deals
- New Arrivals
- Mints
- Accessories
- Charts
- Precious Metals
- Contact
- Currency

Login
|
Register

Free shipping
on orders $149+
Mon - Fri 9-6 EST
+1 (905)605-6757
- Gold
- Silver
- Platinum
- Deals
- New Arrivals
- Charts
- Mints
- Accessories
- Precious Metals
- Contact
- Currency
Login
Register


Free shipping on orders $149+
Live Prices:
Back
Gold Rate Graph: How to Read It and Know How Much Gold Prices Per Gram Today
May 20, 2025
Graph of the Gold Rate
Graphs showing the gold rate can display data from a few days to several years.
- • The X-axis, typically located at the bottom of the graph as a horizontal line, specifies the duration of coverage, which can be 24 hours, seven days, one month, six months, one year, ten years, or more.
- • The pricing of gold is represented by the vertical line on the Y-axis. The graph may depict the price per ounce, gram, or kilogram. Use a gold per gram chart when dealing with smaller amounts.
- • The line on the graph shows how prices changed throughout the period in question. Price rises are indicated by upward trends, whereas price drops are indicated by downward trends.
Price of Gold Per Gram Chart
You will need a chart that displays gold prices in smaller units on a daily basis or in real time in order to get an accurate picture of the current price of gold per gram. In the event that you are interested in purchasing gold jewellery, coins, or even tiny investment bars, these charts will prove to be extremely handy.
- • It clearly shows the gold rate today per gram.
- • High and low points are the highest and lowest prices that occurred during the chosen time range.
- • Volume, which is sometimes included, is a way to assess how much gold is exchanged at different prices.
Find out if it is a good moment to buy or if you should wait for a price drop by comparing the current price to the price from the previous days or weeks.
Helpful Guidance for Prospective Purchasers and Investors
- • If the price of gold continues to fall over many days or weeks, this might be an ideal chance to purchase gold, particularly to invest in or give.
- • There may be a surge in purchasing activity due to fear. Instead, you should look at the general trend of the gold rate graph. To what extent is this a peak or a long-term rise?
- • Buying decisions with a short-term horizon might benefit from using 1-day or 7-day charts. To have a better understanding of the bigger picture, you should look at the gold per gram chart for either one year or five years.
- • Gold is traded on a global scale; nevertheless, local price is impacted by factors such as currency rates and taxes.


